Unlock the power of the Effort/Impact Matrix! Prioritizing work in software and product development is a constant challenge, but fear not! This incredible decision-making tool streamlines the process, helping you swiftly assess priorities and compare work items with ease. Discover the key to effective project planning now!
Simply one of the best decision-making tools available, in terms of how quickly you can provide the inputs needed and compare across work items to see relative priority.
How do you determine what efforts to take on? How do you compare different and varying work and prioritize tasks? If you spend a lot of time investigating work, to try and select work, you run the risk of not having work ready and teams could run out of things to do. Or at least run out of top priority things to do, being forced to select for themselves and grab work to be doing something.
The Effort/Impact Matrix is a tool to look at, to help you prioritize and do so with minimal effort. Use it to find the high-impact projects and do those before all the others.
What is the Effort/Impact Matrix?
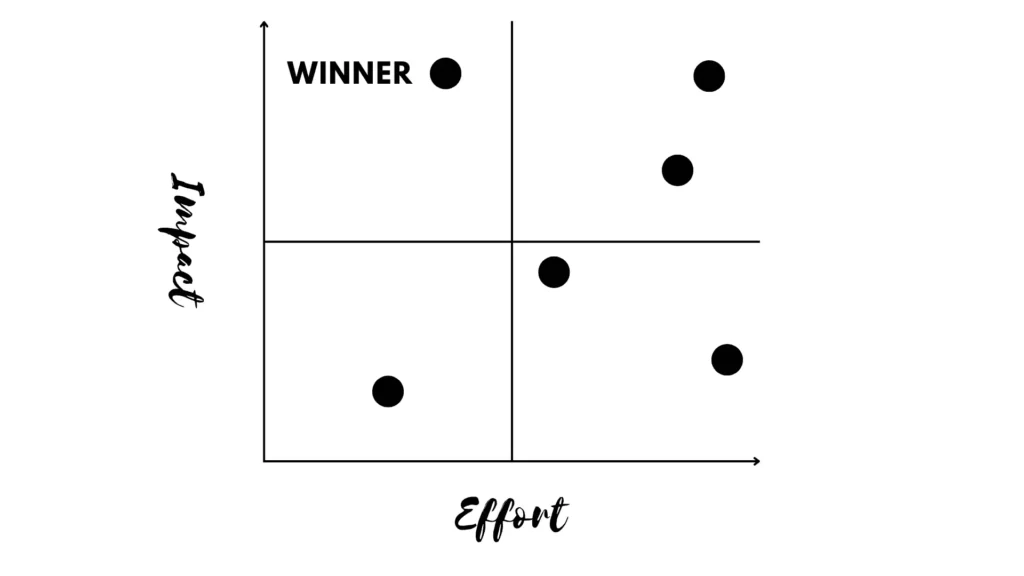
The Effort/Impact Matrix is essentially a grid plotting of the effort vs the impact for a given piece of work. It is a way to visually prioritize tasks. Allowing quick and easy plotting in a graph. Which then allows an even easier relative comparison to other work.
Take the below image as an example. If using impact and effort as you two axis, you visually plot work into the locations that represent their effort vs impact estimation. I like to do this as a quick and dirty estimation of effort and impact. This is to avoid the work of trying to figure out better effort and impact on all items. Helping to make more objective decisions.
Once items are visually plotted, it is very easy to compare the work. Then once some items separate themselves from the pack, more research can be done to understand more accurate effort and impact estimates. You easily see the high-impact projects. The items that are high impact and low effort. Low-effort endeavors are more towards the left in this diagram. In other words, a great visual overview of task prioritization.
How does this framework help you?
The effort/impact matrix is a framework and a tool to help you prioritize work. You can use in many ways to prioritize tasks. I described using as a quick prioritization framework. To help identify items that could get some focus. Or more effort could be put into the efforts and impacts and get more accurate relative comparisons right away. Either is very helpful, as it gives comparison of varying work items.
Too often, the issue in prioritization is the different and varying work. How do you compare, such that you could pick between the work. Having relative effort vs impact estimates, plotted out visually, helps with that relative comparison and thus prioritization. Thus the impact effort matrix becomes an immensely valuable tool.
I would categorize this effort/impact matrix as a lean and agile practice. Lean if you practice low fidelity effort and impact estimations to start. As the process is not eating up a lot of resources to help understand priority. It also is not spending resources on items that are not selected.
I categorize as Agile, as it is a framework to use for your team. It can help your process and your work, but is is really a visual tool and a tool for collaboration or communication. Which Agile processes are all about collaboration and communication.
Effort/impact matrix finds the best return on investment
The effort/impact matrix, also known as the impact/effort matrix, is a valuable decision-making tool that aids in prioritizing tasks based on their potential impact and the effort required for implementation. It plays a crucial role in aligning actions with project goals and achieving a higher return on investment.
By using the matrix, teams can efficiently allocate resources, identify high-impact projects with minimal effort, and save valuable resources on low-impact endeavors. This approach fosters a streamlined workflow, maximizing efficiency and productivity.
Effort vs. Impact mitigates planning fallacy
When assessing potential initiatives, the matrix prompts teams to think realistically about the effort each project demands. This mitigates the planning fallacy, ensuring accurate estimations and preventing underestimation of required efforts.
Furthermore, the effort/impact matrix facilitates objective decisions, particularly when multiple stakeholders are involved. It provides a visual overview of how different projects compare in terms of effort and impact, fostering informed discussions and reducing conflicts.
Ultimately, the effort/impact matrix empowers organizations to prioritize tasks with a laser focus on achieving project success. By concentrating efforts on high-impact endeavors and saving resources on low-impact ones, teams can propel their projects towards remarkable achievements and long-term growth. Use the effort vs. impact matrix to find a sequence of prioritized tasks. Ultimately, to project success.
Additional content and reading to check out that helps effort vs. impact
Agile Estimation and Just In Time Requirements are 2 great ideas that go along with this lightweight prioritization framework. They work well with the impact effort matrix. as they help the team to estimate in an Agile way and not waste effort. It is more valuable to find the low-effort endeavors that will produce value, and do those first. Find the low-hanging fruit that provide benefits and knock them out.
Just In Time Reqs help you to get the info you need to start quickly. Then learn more as you go and create the next round of work. Check them out below.
Also, Check Out Prioritization Frameworks Unpacked!
Also, great info at the below on different prioritization techniques. With a link to an article on the Effort vs Value Matrix, aka the impact effort matrix, here. Use as a decision-making tool and find the cherries at the top of your project goals.